參考書目:《質性研究方法及其超越》
在定性分析的過程中,ATLAS.ti軟體可以幫助你以探索研究的模式,去發現隱藏在你的數據裡的複雜現象。ATLAS.ti 軟體提供一種強有力和直覺的工作環境,設計來使你集中研究物質本身。
ATLAS.ti軟體有4 種優勢的重要工作模式 :
Visualization
Integration
Serendipity
Exploration
There is so much to discover in
the new, powerful ATLAS.ti 7+8, we don't know where to start. Perhaps
we start at the very core: Taking its legendary, central "VISE"
principle to a new level, ATLAS.ti 7 can truly be said to be
"VISE-r" than ever.
Visualize: The margin reloaded: Work with audio and video
just as natural as you are used to with text and images. Code Tag
Views, integrated frequency bars, a superb new network editor, list
previews of documents and analysis items.
Integrate: Need for open windows drastically reduced. No need
to open multiple windows to visualize your data. Activate visuals
right there in the workspace you are using!
Serendipity: Create and navigate your hyperlinks between
sections of text, images, audio and video in the most natural
synoptic way with up to four documents of any kind displayed and
interconnected, side-by-side.
Exploration: The co-occurrence table tool, the
codes-documents table, the neat side-panel filter area for the item
managers, the search field to comfortably find your way through
thousands of items in milliseconds, and a completely refurbished
network editor.
Features
Multimedia
ATLAS.ti offers absolute state-of-the art multimedia processing.
Frame-level and wave previews make coding audio and video material a
joy; images can be fully coded in every detail and segments even be
moved and re-sized.
Audio and
Video documents
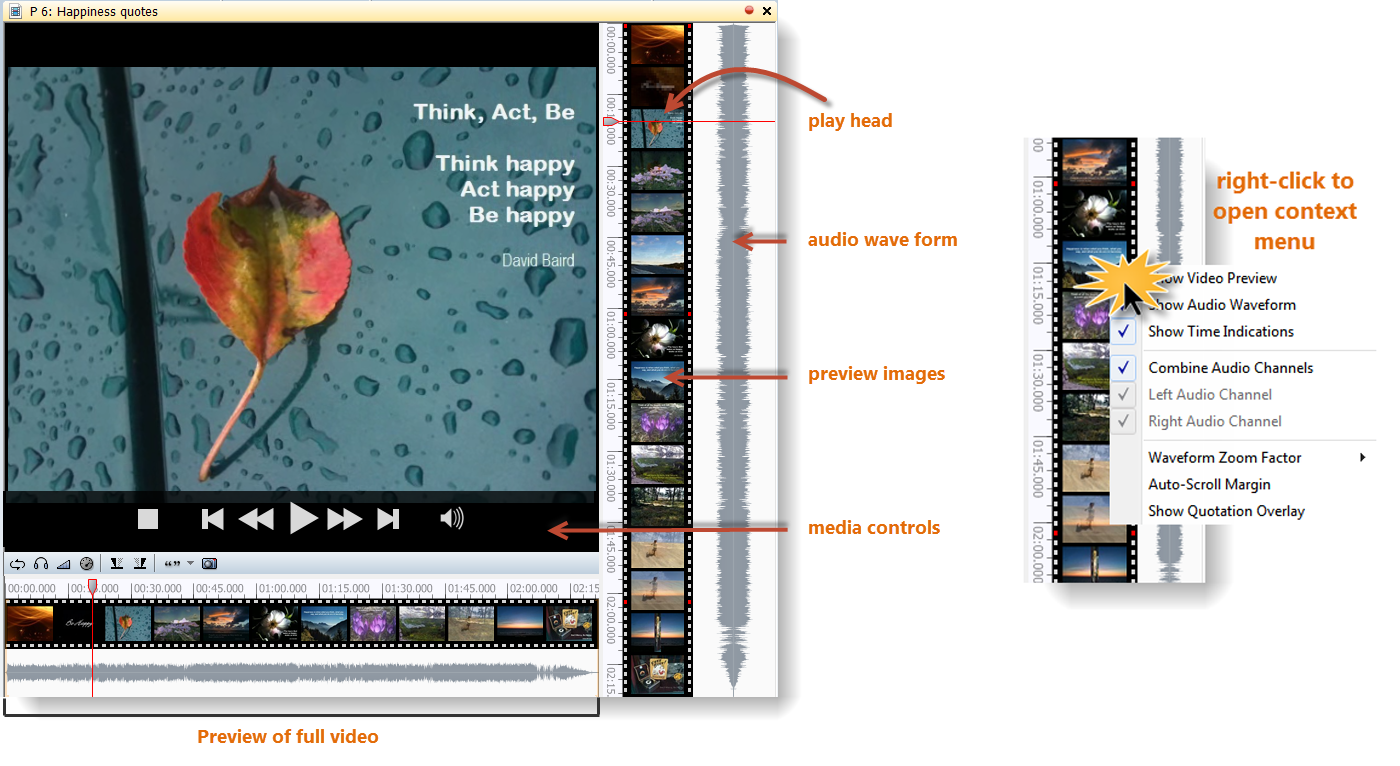
When you add a video document to a project, preview images are
created. Next to the preview images you see the audio wave form. By
right-clicking on the video preview you can set a number of display
options in the context menu.
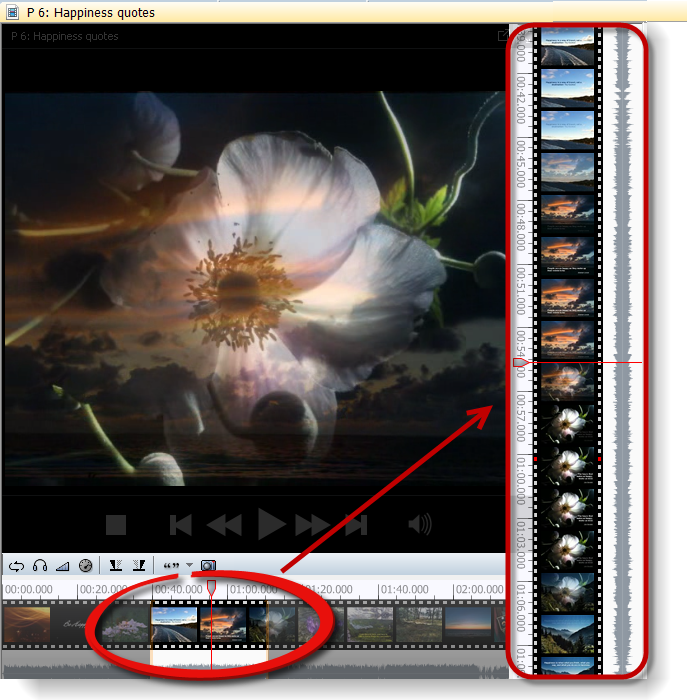
Zooming In
Sliders appear when you move the mouse pointer over the full
preview and let you select just the section of the video that you
want to see in the margin area:
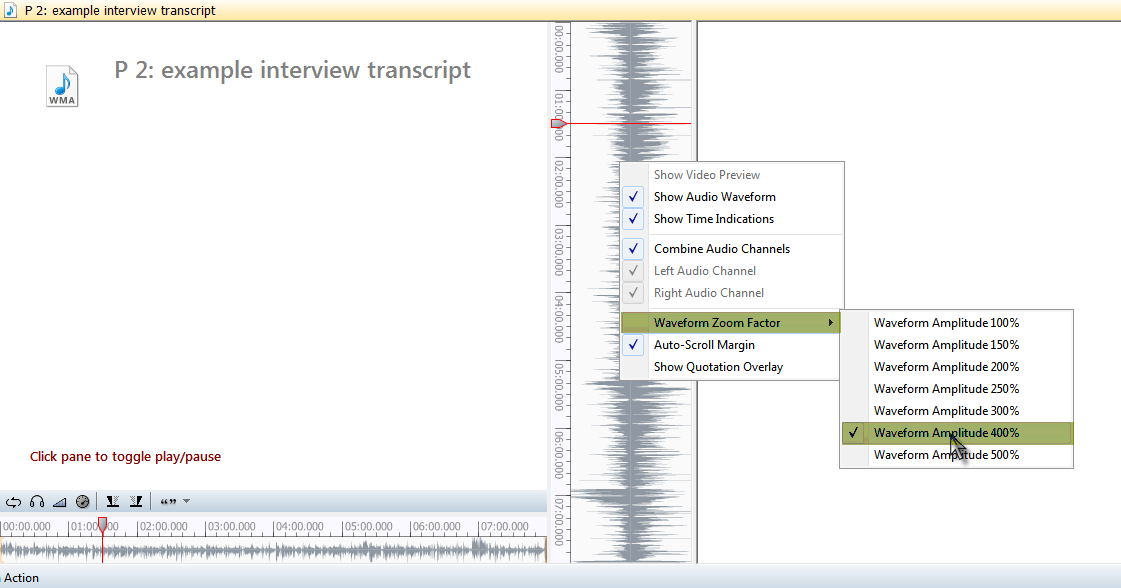
Display of
Audio files
Audio files are displayed in a similar manner, but instead of
the video image, you see a white background displaying the file name
and the audio wave form. The audio wave can be zoomed:
Multi-Document View
You can open up to four documents side-by-side in the ATLAS.ti HU
editor. Obviously, this opens up fantastic possibilities for
comparative work, and makes your work faster and more efficient all
around.
Work on
Multiple Documents At The Same Time
Documents can be dragged from the navigation pane or the P-Docs
Manager onto the region button to open them.
Work on all open documents in their own margin-areas. All features
and tools are available, so you can code, link, and annotate all in
the same way as you would a singe document.
You can switch the margin area off if you simply want to compare
documents. Also, to change the position of the documents, via drag &
drop it into the desired document region:
Linking Across Documents
The multi-document view makes it easy to link sections across
various documents. Simply drag and drop a quotation between regions
(1) to create what is called a hyperlink (3) in ATLAS.ti. The
relation between the two data segments can be labeled (2), e.g.
using a relation like supports, explains, contracts or discusses.
You can chose amongst a number of predefined lables or create your
own.
Analytical Tools
ATLAS.ti 7 is a powerful analytical tool. Its individual analysis
options are centrally organized and designed for maximum efficiency,
accuracy, and performance. Cloud views provide very quick, accurate,
and yet intuitive analytical access to your data material. The query
tool, ccooccurence explorer and the codes-PD-table allow in-depth
analysis.
Visualization
ATLAS.ti 7 is a highly visually oriented tool. Starting with the
user interface—which is laid out with a maximum in user convenience
and maximum use of screen-space in mind—to the various Object
Managers to the intelligent Network Views: Everything is equally
intuitive and efficient.
Full Native PDF Support
ATLAS.ti's full native PDF support lets you work with PDF files in
their native layout, just the way you would expect it. No ifs and
buts.
ATLAS.ti
treats your PDF documents exactly like the Acrobat Reader: Work as
smoothly and flexibly as you would in Acrobat, utilize bookmarks and
tables of content, scrolling, and flexible page views. And code to
your heart's delight - text, images, anything that's on the page,
down to whatever level of detail you desire! Annotate, comment,
link, search and query, visualize your results - it's what
computer-based data analysis was always meant to be.
Geo-Coding
A most exciting feature – and one that is likely to change the way
you work if you haven't used it yet – is ATLAS.ti's geo-coding
support.
ATLAS.ti
embeds Google Earth™ and makes its functionality available from
inside the program. This has immense benefits and opens up fantastic
possibilities for your work.
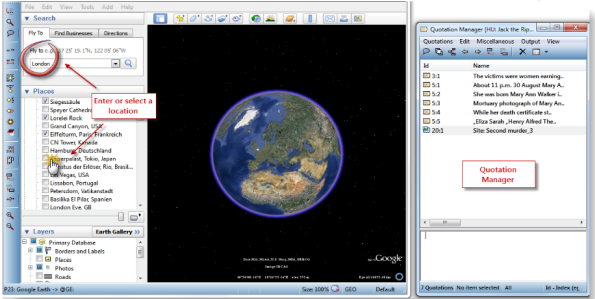
Picture, if
you will, the world as your ultimate primary document. Freely move
around in it and mark any section that interests you. Then, treat
that segment exactly the way you are used to in ATLAS.ti. Code it,
comment it, and link it to other objects. Use direct hyperlinks from
other primary documents for supporting your arguments and for
purposes of evidence or illustration.
The geo-coding facility even creates screenshots from any Google
Earth™ view and assigns them as graphical primary documents. This
"snapshot" helps you save system resources and makes sure that your
reference is secured against changes.
Suvery Import
Imagine converting the results of a large online survey into a
Hermeneutic Unit in ATLAS.ti with just a few mouse clicks. ATLAS.ti
lets you do just that!
Here is a typical work flow:
1.
Create an online survey using, for example, Google Docs (a very
convenient tool, although other frameworks are supported as well)
2.
Download and store the survey as an Excel table once your
respondents have filled out the questionnaire
3.
Import the table into ATLAS.ti
4.
Voilà: Each row (= one respondent) becomes a primary document, and
content is collected and created from the answers to open-ended
questions. PD families are created from single and multiple-choice
questions; quotations are created for each answer and coded with the
respective question (you may use abbreviations). This accomplishes a
lot of tedious pre-coding work in a few seconds.
|